



Article
Call Center Occupancy: Formula and Benchmarks
Occupancy is one of the most misread metrics in call center management. Getting occupancy call center targets right determines whether agents can sustain performance across a full shift. WFM teams track it alongside utilization and productivity, often using the terms interchangeably. Staffing decisions get made on the wrong number. Agents burn out because the model said occupancy was fine at 91%. Service levels slip because the model said agents were available.
Getting occupancy call center measurement right is straightforward once the definition is clear. This article covers what is occupancy in call center terms, how to calculate it with a real example, what the right occupancy rate call center targets look like, and how it differs from utilization, the metric it is most often confused with.
Key takeaways
What is occupancy in a call center?
Occupancy in a call center is the percentage of logged-in time that agents spend on call-related activity. It measures how busy agents are while they are available to take contacts, not across their entire shift.
Call-related activity includes two components:
- Talk time: the time the agent spends in active conversation with the customer
- After-call work (ACW): the time immediately following a call spent completing case notes, updating records, or completing any required wrap-up before the agent returns to available status
What occupancy does not include is everything outside the logged-in queue window: breaks, training, team meetings, coaching sessions, and other scheduled off-phone activities. These are captured by a separate metric called shrinkage.
The occupancy call center formula is used by WFM teams in the following form:
Occupancy = (Handle Time ÷ (Handle Time + Available Time)) × 100
Where:
- Handle Time = Talk Time + After-Call Work Time
- Available Time = time the agent is logged in and waiting for the next contact
If an agent handles 40 minutes of calls and ACW in a 60-minute window and is available (waiting) for 20 minutes, their occupancy for that period is (40 ÷ 60) × 100 = 67%.
Call center occupancy is a real-time and interval-level metric. A daily average hides the variance that actually matters for agent welfare and service level management.
Occupancy formula: how to calculate agent occupancy
The occupancy formula call center teams use is:
Occupancy (%) = (Handle Time / (Handle Time + Available Time)) × 100
Handle Time = Talk Time + After-Call Work Time
Worked example
An agent works a 60-minute interval with the following logged data:
| Component | Time |
| Talk time (in active calls) | 33 minutes |
| After-call work (ACW) | 9 minutes |
| Total Handle Time | 42 minutes |
| Available time (waiting for next call) | 18 minutes |
| Total logged-in time | 60 minutes |
Agent occupancy = (42 ÷ 60) × 100 = 70%
At 70%, this agent is within a healthy range. They have 18 minutes of available time in the hour, enough buffer to handle volume without sustained pressure on call quality or fatigue.
Now apply the same formula to a busier interval:
| Component | Time |
| Talk time | 44 minutes |
| After-call work | 8 minutes |
| Total Handle Time | 52 minutes |
| Available time | 8 minutes |
| Total logged-in time | 60 minutes |
Agent occupancy = (52 ÷ 60) × 100 = 87%
At 87%, this agent is at the top of the healthy range. If this persists across multiple intervals, ACW starts to get rushed, quality scores drop, and the agent begins the shift exhausted.
The occupancy formula call center teams need to apply at the interval level, typically per 15 or 30 minutes, to see where pressure is building before it becomes a quality or welfare problem.
Occupancy rate in a call center: what is a good target?
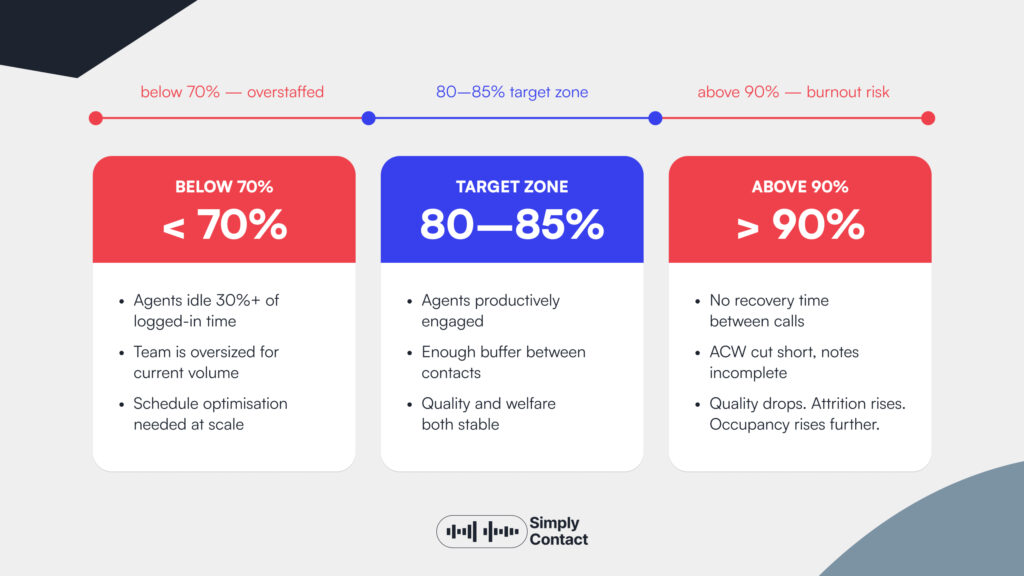
The industry benchmark for call center occupancy is 80–85%. This range is supported by workforce management research across multiple sectors and reflects the point at which agents are productively engaged without sustained pressure.
What happens above 90%
An occupancy rate above 90% means agents have almost no available time between contacts. ACW gets cut short. Notes are incomplete. Agents do not have the mental reset that the available period provides between calls. Across a shift, this compounds into lower call quality, higher error rates, and accelerated fatigue. Call centres that run above 90% occupancy consistently see higher attrition. Experienced agents leave faster than they can be replaced, which increases average occupancy further as the team shrinks against fixed volume.
What happens below 70%
An occupancy rate below 70% typically indicates overstaffing relative to current volume. Agents are available (waiting for contacts) for more than 30% of their logged-in time. This is a cost problem: the team has more capacity than the workload requires. In small teams or low-volume queues this can be structurally unavoidable, but at scale it represents an efficiency gap that WFM should address through schedule optimisation.
How team size affects the target
The right call center occupancy target is not the same for every operation. A small team of six agents handling specialised contacts needs a lower occupancy target than a large team of 60 handling high-volume routine contacts. Erlang calculations show that smaller teams have higher variance in contact arrival, which requires more available buffer to maintain service levels. The 80–85% benchmark applies most directly to mid-size and large operations. Small teams running at 85% occupancy will consistently miss service levels during short volume bursts.
Call center occupancy vs utilization: key differences
Occupancy and utilization are related but distinct metrics. Confusing them produces staffing decisions based on the wrong number.
| Occupancy | Utilization | |
| What it measures | Time on call-related work vs logged-in available time | Time logged in vs total scheduled shift time |
| Includes | Talk time + ACW | All logged-in time including available time |
| Excludes | Breaks, training, admin, other shrinkage | Nothing within the schedule window |
| Formula | (Handle Time ÷ Available + Handle Time) × 100 | (Logged-in Time ÷ Total Shift Time) × 100 |
| Typical benchmark | 80–85% | 85–90% |
| What it tells you | How busy agents are while available for contacts | How much of the scheduled shift is productive time |
| Primary use | Real-time WFM, interval-level monitoring | Schedule efficiency, shrinkage management |
Why the distinction matters in practice
A WFM team that tracks utilization but not occupancy can have agents with 88% utilization and 94% occupancy simultaneously. The utilization number looks healthy. The occupancy number means agents are at sustained burnout risk.
The reverse is also possible: an agent with 75% occupancy can have 72% utilization if shrinkage is high. The occupancy looks fine. The agent is not overworked when available. But the team is spending 28% of scheduled shift time in training, meetings, and admin, which reduces actual contact-handling capacity significantly.
Both metrics are needed. Call center occupancy vs utilization is not a choice between them. It is an understanding of what each one tells you and when to act on each signal. The call center quality assurance guide covers how to build a metrics framework that connects occupancy to quality outcomes.
Key considerations when using agent occupancy as a KPI
Interval-level monitoring vs daily averages
A daily average occupancy of 83% can hide an interval at 96% followed by one at 70%. The agent who ran at 96% for two hours is exhausted and producing lower quality work, regardless of what the daily average shows. WFM teams that monitor occupancy at 15 or 30-minute intervals can intervene in real time. Teams that review daily averages discover problems after they have already affected quality and staff welfare.
Volume spikes hit individual agents
In a small team, a volume spike does not average out across many agents. A team of eight where two agents are on break when a volume surge arrives means the remaining six absorb the full load. Agent occupancy for those six may spike to 95%+ for the duration, even if the team average for the day stays within target. Staffing models that plan for average volume without building in resilience for spikes use occupancy benchmarks correctly but apply them to the wrong problem.
Shrinkage is not included in occupancy
This is the most common source of confusion between occupancy and utilization. Shrinkage (breaks, training, coaching, team meetings, and unplanned absence) reduces the available agent pool but does not appear in the occupancy calculation. A team that looks fully staffed on paper can be running high occupancy in practice because shrinkage has reduced the logged-in agent count. WFM models need to include shrinkage assumptions in headcount planning, separate from occupancy targets.
Multi-skill agents skew occupancy data
An agent handling both voice and email contacts in the same interval has a different occupancy profile than a voice-only agent. Email ACW is typically longer. Contact arrival is less predictable across channels. Reporting occupancy as a single number for a blended team obscures where the pressure is actually sitting. Occupancy should be tracked by queue or contact type where multi-skill blending is in use.
High occupancy can mask service level failures
An operation running 90% occupancy and hitting service level looks efficient on both metrics simultaneously. But the service level is being met by agents who have almost no recovery time between contacts. Quality is being sustained by agent effort, not by process design. When volume increases slightly, or when an experienced agent leaves, both metrics fall together. High agent occupancy should prompt a review of whether service level is being met sustainably or by burning through agent capacity.
How to improve call center occupancy without burning out agents
Accurate volume forecasting at the interval level
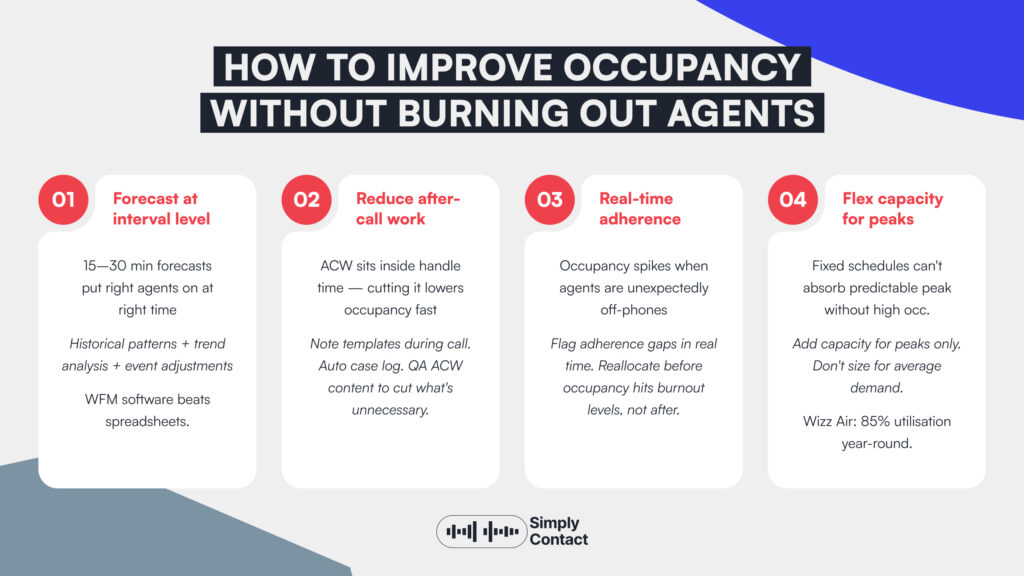
The single most effective tool for keeping call center occupancy within the target range is accurate volume forecasting. A schedule built on correct volume predictions at 15 or 30-minute intervals puts the right number of agents on the phones at the right time. Overstaffing drops occupancy below target; understaffing raises it above. Both are forecasting failures. WFM software that uses historical contact patterns, trend analysis, and event-based adjustments produces better forecasts than spreadsheet-based planning.
Reduce after-call work time
ACW is directly within the handle time component of the occupancy formula. If ACW is long, occupancy rises for every contact handled. Reducing ACW is one of the fastest routes to bringing high occupancy down without reducing staffing. Practical approaches include: structured note templates that agents complete during the call rather than after, automatic case logging integrated with the phone system, and QA review of ACW content to identify what agents are actually doing in that time and whether all of it is necessary.
Real-time adherence and reallocation
Occupancy spikes in specific intervals when agents are off the phones due to unplanned absence or schedule adherence issues. Real-time WFM tools that flag adherence gaps allow supervisors to reallocate available agents or pull agents from training to cover the queue before occupancy reaches burnout levels.
Flex capacity for peak intervals
Some occupancy variance is structural. Volume peaks at predictable times of day or week that a fixed schedule cannot absorb without running high occupancy during peaks and low occupancy during troughs. Flex staffing that adds capacity specifically for peak intervals, without full-day scheduling, is the structural solution to this. Simply Contact's operations for Wizz Air demonstrate this at scale: 85% average agent utilisation maintained across high and low seasons by building flex capacity into the staffing model rather than sizing for average demand. The back office workforce management guide covers how the same principle applies to async queue-based operations.
Occupancy is a balancing act
The goal is not the highest possible occupancy. It is occupancy in the range that keeps agents productive without burning them out, service levels met without sacrificing quality, and staffing costs aligned with actual contact volume.
At 80–85%, agents have enough active time to justify their cost and enough recovery time to maintain the quality of every contact they handle. Managing to that range, at the interval level rather than the daily average, is what separates WFM operations that sustain quality from those that extract performance until something breaks.
Get in touch to explore how Simply Contact's WFM model maintains target occupancy across peak and off-peak demand.

Newsletter
Subscribe
Subscribe to our newsletter to receive valuable industry insights and the latest research reports.